Wednesday, May 17, 2006
y10 help sheet
Coursework
Aim The aim of this experiment is to investigate how the number of layers of newsprint affects the rate of heat loss.
State the aim and context of the experiment in your own words.
Plan
Describe how you are going to perform your experiment.
This should be written so a small child can read your account and perform the experiment without asking any questions. Include an apparatus list and describe how you will ensure your test is fair. Include a paragraph on safety. (Grade D)
Draw out a table that you intend to use for your results. You should not enter any readings in this table. (Grade C)
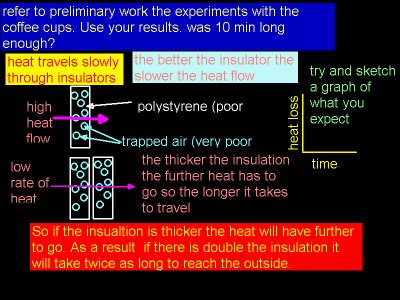
By discussing the experiments we performed earlier in the year explain why you have chosen to do the experiment in this way. Use your actual results. (Grade A)
Describe how the container will lose heat, and how the paper will reduce the rate of heat losses. Make a prediction. E.g. I predict that the rate of heat loss will not be proportional to the number of layers of paper. Write this in our own words. Sketch a graph. Try and give a reason why you predict this. (Grade A or C)
Observations
These should be recorded in tables. Several temperatures should be to ½ 0C.
Analysis
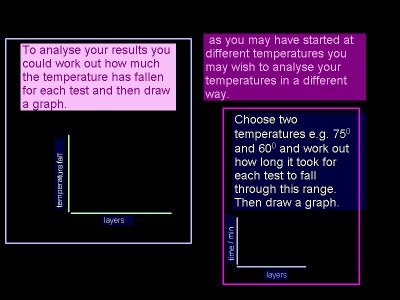
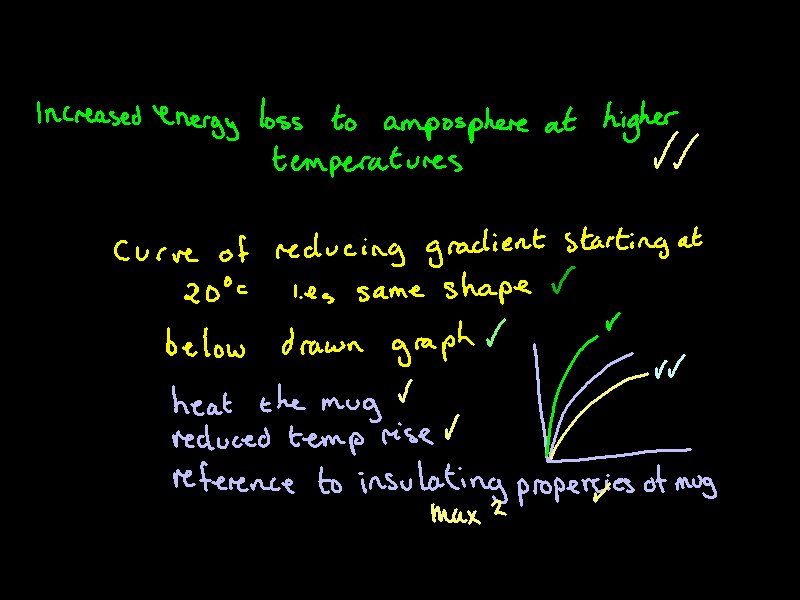
You should draw cooling curves for all of your results. You should analyse these to find the time taken for your test to fall from 750C to 600C. You should then plot a graph of number of layers against time to fall by 200C.
State how the rate of temperature loss changes with thickness of insulation. Describe the shape of the graph. If the graph is a straight line then the thickness of the insulation is directly proportional to the rate of heat loss (grade C) higher grades require a detailed summing up of the evidence related to the theory.
Evaluation.
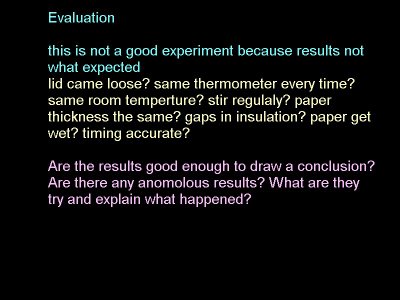
Describe the problems with your method.
Improvements. What minor improvements to your apparatus or method would have improved your results? Any use of computers must be detailed with diagrams. (Grade C or A)
Quality of Results Are there any obvious results that do not fit into your pattern. These are anomalous. Consider the accuracy of your measurements. What other ways heat is being lost? Can you draw a valid conclusion considering these factors? (Grade C or A)
Aim The aim of this experiment is to investigate how the number of layers of newsprint affects the rate of heat loss.
State the aim and context of the experiment in your own words.
Plan
Describe how you are going to perform your experiment.
This should be written so a small child can read your account and perform the experiment without asking any questions. Include an apparatus list and describe how you will ensure your test is fair. Include a paragraph on safety. (Grade D)
Draw out a table that you intend to use for your results. You should not enter any readings in this table. (Grade C)
By discussing the experiments we performed earlier in the year explain why you have chosen to do the experiment in this way. Use your actual results. (Grade A)
Describe how the container will lose heat, and how the paper will reduce the rate of heat losses. Make a prediction. E.g. I predict that the rate of heat loss will not be proportional to the number of layers of paper. Write this in our own words. Sketch a graph. Try and give a reason why you predict this. (Grade A or C)
Observations
These should be recorded in tables. Several temperatures should be to ½ 0C.
Analysis
You should draw cooling curves for all of your results. You should analyse these to find the time taken for your test to fall from 750C to 600C. You should then plot a graph of number of layers against time to fall by 200C.
State how the rate of temperature loss changes with thickness of insulation. Describe the shape of the graph. If the graph is a straight line then the thickness of the insulation is directly proportional to the rate of heat loss (grade C) higher grades require a detailed summing up of the evidence related to the theory.
Evaluation.
Describe the problems with your method.
Improvements. What minor improvements to your apparatus or method would have improved your results? Any use of computers must be detailed with diagrams. (Grade C or A)
Quality of Results Are there any obvious results that do not fit into your pattern. These are anomalous. Consider the accuracy of your measurements. What other ways heat is being lost? Can you draw a valid conclusion considering these factors? (Grade C or A)


Tuesday, May 09, 2006


Monday, May 08, 2006
y11
The topics covered in this lesson were published on Friday.
The answers to the worksheets are published here.
http://physicstwyford.blogspot.com/
The answers to the worksheets are published here.
http://physicstwyford.blogspot.com/


Friday, May 05, 2006


Thursday, May 04, 2006


Tuesday, May 02, 2006

Subscribe to:
Posts (Atom)